@junvictor wrote:
Hi guys:
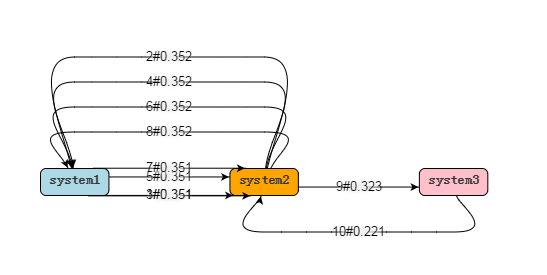
I am leaning gojs to show the transaction flow , but now there is a problem, the diagram shows like the following:
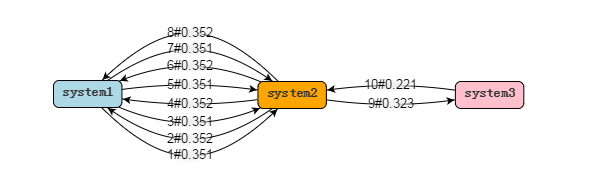
Then I use the mouse to drag one of the components , It turns OK:
Can you help me ? why the links in the first pic is not friendly?
my codes as following:
================================================================
function init() {
if (window.goSamples) goSamples(); // init for these samples -- you don't need to call this
var $ = go.GraphObject.make; // for conciseness in defining templatesmyDiagram = $(go.Diagram, "myDiagramDiv", // create a Diagram for the DIV HTML element { initialContentAlignment: go.Spot.Center, "undoManager.isEnabled": true }); myDiagram.nodeTemplate = $(go.Node, "Auto", //{ mouseOver: function (e, obj){ nodeDoubleClick(e, obj) }}, { locationSpot: go.Spot.Center }, $(go.Shape, "RoundedRectangle", { fill: "white", // the default fill, if there is no data-binding portId: "", cursor: "pointer", // the Shape is the port, not the whole Node fromLinkable: false, fromLinkableSelfNode: false, fromLinkableDuplicates: false, toLinkable: false, toLinkableSelfNode: false, toLinkableDuplicates: false }, new go.Binding("fill", "color")), $(go.TextBlock, { font: "bold 14px sans-serif", stroke: '#333', margin: 6, // make some extra space for the shape around the text isMultiline: false, // don't allow newlines in text editable: false // allow in-place editing by user }, new go.Binding("text", "text").makeTwoWay()) // the label shows the node data's text ); myDiagram.layout = $(go.LayeredDigraphLayout, { layerSpacing: 100, setsPortSpots: false }); // The link shape and arrowhead have their stroke brush data bound to the "color" property myDiagram.linkTemplate = $(go.Link, { curve: go.Link.Bezier }, $(go.Shape, { strokeWidth: 1 }, new go.Binding("stroke", "color")), $(go.Shape, { toArrow: "Standard", stroke: null }, new go.Binding("fill", "color")), $(go.Panel, "Auto", $(go.Shape, // the label background, which becomes transparent around the edges { fill: $(go.Brush, "Radial", { 0: "rgb(240, 240, 240)", 0.3: "rgb(240, 240, 240)", 1: "rgba(240, 240, 240, 0)" }), stroke: null }), $(go.TextBlock, "transition", // the label text { textAlign: "center", font: "10pt helvetica, arial, sans-serif", margin: 0, editable: false // enable in-place editing }, new go.Binding("text").makeTwoWay()) ) ); // Create the Diagram's Model: var nodeDataArray = [ { key: 0, text: "system1", color: "lightblue" }, { key: 1, text: "system2", color: "orange" }, { key: 2, text: "system3", color: "pink"} ]; var linkDataArray = [ { "from": 0, "to": 1, "text": "1#0.351"}, { "from": 1, "to": 0, "text": "2#0.352"}, { "from": 0, "to": 1, "text": "3#0.351"}, { "from": 1, "to": 0, "text": "4#0.352"}, { "from": 0, "to": 1, "text": "5#0.351"}, { "from": 1, "to": 0, "text": "6#0.352"}, { "from": 0, "to": 1, "text": "7#0.351"}, { "from": 1, "to": 0, "text": "8#0.352"}, { "from": 1, "to": 2, "text": "9#0.323" }, { "from": 2, "to": 1, "text": "10#0.221" } ]; myDiagram.model = new go.GraphLinksModel(nodeDataArray, linkDataArray);}
Posts: 5
Participants: 2