@sree1 wrote:
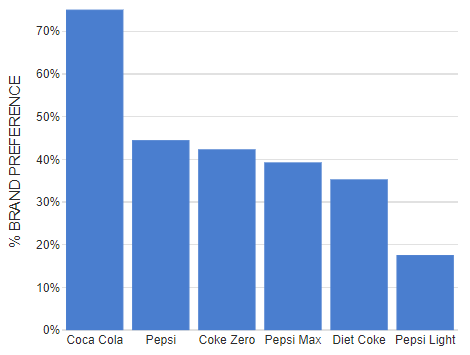
How to make a bar chart with X-Axis and Y-axis, and how to give our own values to the Y-axes.
.
I want to create a bar graph exactly look like this. please share the code.
 .
.Posts: 2
Participants: 2
@sree1 wrote:
How to make a bar chart with X-Axis and Y-axis, and how to give our own values to the Y-axes.
.
I want to create a bar graph exactly look like this. please share the code.
Posts: 2
Participants: 2