Hello,
I am developing a Gantt diagram, in which it will cover several “projects”.
I’ve been looking at your examples, namely:
and I find myself adapting them for my case.
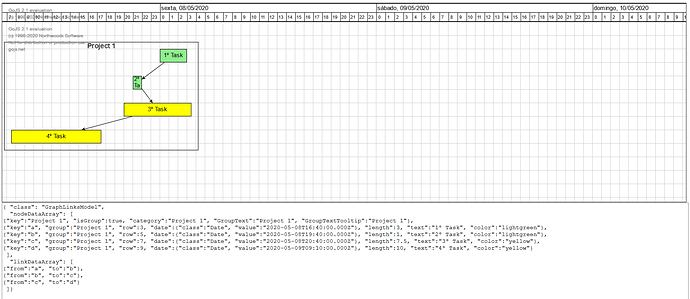
My problem at this point is that somehow the dates that I enter aren’t appearing in the grid in their correct positions. Instead of each node advance in time, they are going back in time.
Example:
Origin Date = 2020/05/08 18:38
First node = 2020/05/08 18:38, so it should appear at the gradScaleHoriz1 = 2020/05/08 and gradScaleHoriz2=18(plus the minutes)
I noticed 2 things:
-
A comment that we should assume that x == 0 is the local midnight of some date
// Assume x == 0 is OriginDate, local midnight of some date.
var OriginDate = new Date();
-
This function that take in account the Origin date and the data value of the node I introduce, and subtracts.
function convertDateToX(dt) { return (OriginDate.valueOf() - dt.valueOf()) / MillisPerPixel; }
And I have been “back in forth” trying to solve this for the past days… but still no solution for my problem.
Can you tell me what is causing this? And how to fix it?
<!DOCTYPE html>
<html>
<head>
  <meta charset="UTF-8">
  <title>Gantt chart</title>
  <meta name="description" content="A Gantt chart that supports zooming into the timeline." />
  <meta name="viewport" content="width=device-width, initial-scale=1">
  <script src="go.js"></script>

 <script id="code">
  // Define Graduated Panels to show the days, to show the hours, and to separate the days and hours.

  // Assume x == 0 is OriginDate, local midnight of some date.
  var OriginDate = new Date(2020,04,08,17,40);

  // Assume 20 document units equals one hour.
  var HourLength = 20;
  var HoursPerDay = 24;
  var DayLength = HourLength * HoursPerDay;
  var MillisPerHour = 60 * 60 * 1000;
  var MillisPerPixel = MillisPerHour / HourLength;

  function init() {
    var $ = go.GraphObject.make;

    myDiagram =
      $(go.Diagram, "myDiagramDiv",  // create a Diagram for the DIV HTML element
        {
          isReadOnly: true,       // deny the user permission to alter the diagram or zoom in or out
          "animationManager.isEnabled": false,
          initialContentAlignment: go.Spot.TopLeft,
          grid:
            $(go.Panel, "Grid",
              { gridCellSize: new go.Size(HourLength, 30) },
              $(go.Shape, "LineH", { stroke: 'lightgray' }),
              $(go.Shape, "LineV", { stroke: 'lightgray' }),
            ),
          "draggingTool.isGridSnapEnabled": true,
          "resizingTool.isGridSnapEnabled": true,
          scrollMode: go.Diagram.InfiniteScroll,  // allow the diagram to be scrolled arbitrarily beyond content
          positionComputation: function(diag, pos) {  // but not too far vertically, or at all if fits in viewport
            var y = pos.y;
            if (diag.documentBounds.height < diag.viewportBounds.height) {
              y = 0;
            } else {
              y = Math.min(y, diag.documentBounds.bottom - diag.viewportBounds.height);
              if (y < 0) y = 0;  // don't show negative Y coordinates
            }
            return new go.Point(pos.x, y);
          },
          nodeTemplate:
            $(go.Node, "Auto",
              {
                height: 30,
                dragComputation: function(part, pt, gridpt) {
                  return new go.Point(gridpt.x, Math.max(0, gridpt.y));
                },
                resizable: true,
                resizeAdornmentTemplate:
                  $(go.Adornment, "Spot",
                    $(go.Placeholder)//, //Comentado permite com que ele faça resize às "caixas"
                    //$(go.Shape,  // only a right-side resize handle
                    //  { alignment: go.Spot.Right, cursor: "col-resize", desiredSize: new go.Size(8, 8), fill: "dodgerblue" })
                  ),
                toolTip:
                  $("ToolTip",
                    $(go.TextBlock,
                      new go.Binding("text", "", function(data) { return data.text + "\nstart: " + data.date + "\nhours: " + data.length; }))
                  )
              },
              new go.Binding("position", "", function(data) { return new go.Point(convertDateToX(data.date), convertRowToY(data.row)); })
                .makeTwoWay(function(pos, data) { data.row = convertYToRow(pos.y); data.date = convertDateToX(pos.x); }),
              new go.Binding("width", "length", function(l) { return l * HourLength; })
                .makeTwoWay(function(w) { return w / HourLength; }),
              $(go.Shape, { fill: "white" },
                new go.Binding("fill", "color")),
              $(go.TextBlock, { editable: false }, //editable = true, permite com que ele alterar o texto
                new go.Binding("text").makeTwoWay())
            ),
          "ModelChanged": function(e) {  // just for debugging
            if (e.isTransactionFinished) {
              document.getElementById("mySavedModel").value = e.model.toJson();
            }
          },
          "undoManager.isEnabled": false // Se for igual a true, faz as funcionalidades do CTRL-Z
        });

    myColumnHeaders =
      $(go.Diagram, "myColumnHeadersDiv",
        {
          isReadOnly: true,
          "animationManager.isEnabled": false,
          initialContentAlignment: go.Spot.TopLeft,
          allowHorizontalScroll: false,
          allowVerticalScroll: false,
          allowZoom: false,
          padding: 0
        });


    // Basic coordinate conversions, between Dates and X values, and between rows and Y values:

    function convertXToDate(x) { return new Date(OriginDate.valueOf() + x * MillisPerPixel); }

    function convertDateToX(dt) { return (OriginDate.valueOf() - dt.valueOf()) / MillisPerPixel; }

    function convertYToRow(y) { return Math.floor(y/30) + 1; }  // assume one-based row indexes

    function convertRowToY(i) { i = Math.max(i, 1); return (i-1) * 30; }


    function initColumnHeaders() {
      // Assume the Graduated Panels showing the days and hours are fixed in the document;
      // and by disallowing scrolling or zooming they will stay in the viewport.

      var gradScaleHoriz1 =
        $(go.Part, "Graduated",  // show days
          { layerName: "Grid", position: new go.Point(0, 0), graduatedTickUnit: HourLength },
          $(go.Shape, { geometryString: "M0 0 H3600" }),
          $(go.Shape, { geometryString: "M0 0 V20", interval: HoursPerDay }),  // once per day
          $(go.TextBlock,
            {
              font: "10pt sans-serif", interval: HoursPerDay,
              alignmentFocus: new go.Spot(0, 0, -2, -4),
              graduatedFunction: function(v) {
                var d = new Date(OriginDate);
                d.setDate(d.getDate() + v / DayLength);
                // format date output to string
                var options = { weekday: "short", month: "short", day: "2-digit", year: "numeric" };
                return d.toLocaleDateString("pt-PT", options);
              }
            })
        );

      var gradScaleHoriz2 =
        $(go.Part, "Graduated",  // show hour of day
          { layerName: "Grid", position: new go.Point(0, 20), graduatedTickUnit: HourLength },
          $(go.Shape, { geometryString: "M0 30 H3600" }),
          $(go.Shape, { geometryString: "M0 0 V20" }),  // every hour
          $(go.TextBlock,
            {
              font: "7pt sans-serif",
              segmentOffset: new go.Point(7, 7),
              graduatedFunction: function(v) {
                v = (v / HourLength) % HoursPerDay;  // convert document coordinates to hour of day
                if (v < 0) v += HoursPerDay;
                return Math.floor(v).toString();
              }
            }
          )
        );

      // Add each part to the diagram
      myColumnHeaders.add(gradScaleHoriz1);
      myColumnHeaders.add(gradScaleHoriz2);

      // Add listeners to keep the scales/indicators in sync with the viewport
      myDiagram.addDiagramListener("ViewportBoundsChanged", function(e) {
        var vb = myDiagram.viewportBounds;

        // Update properties of horizontal scale to reflect viewport
        gradScaleHoriz1.graduatedMin = vb.x;
        gradScaleHoriz1.graduatedMax = vb.x + vb.width;
        gradScaleHoriz1.elt(0).width = myColumnHeaders.viewportBounds.width;

        gradScaleHoriz2.graduatedMin = vb.x;
        gradScaleHoriz2.graduatedMax = vb.x + vb.width;
        gradScaleHoriz2.elt(0).width = myColumnHeaders.viewportBounds.width;
      });
    }

    function initRowHeaders() {
      myDiagram.addDiagramListener("ViewportBoundsChanged", function(e) {
        // Automatically synchronize this diagram's Y position with the Y position of the main diagram, and the scale too.
        myRowHeaders.scale = myDiagram.scale;
        myRowHeaders.position = new go.Point(0, myDiagram.position.y);
      });

      myDiagram.addDiagramListener("DocumentBoundsChanged", function(e) {
        // The row headers document bounds height needs to be the union of what's in this diagram itself and
        // the what's in the main diagram; but the width doesn't matter.
        myRowHeaders.fixedBounds = new go.Rect(0, myDiagram.documentBounds.y, 0, myDiagram.documentBounds.height)
          .unionRect(myRowHeaders.computePartsBounds(myRowHeaders.parts));
      });
    }

    function initRows() {


      myDiagram.groupTemplateMap.add("Project 1",
      $(go.Group, "Auto",
        $(go.Shape, { fill: "transparent", stroke: "black" }),
        $(go.Placeholder, { padding: 15 }),
        $(go.TextBlock,{
                alignment: go.Spot.Top,
                editable: false,
                margin: 1,
                font: "bold 15px sans-serif",
                opacity: 0.75,
              },
        new go.Binding("text", "GroupText")),
        {
          toolTip:
            $("ToolTip",
              $(go.TextBlock, { margin: 4 },
                new go.Binding("text", "GroupTextTooltip"))
            )
        }
      ));

      myDiagram.model = new go.GraphLinksModel(
        [
            { key: "Project 1", isGroup: true, category: "Project 1", GroupText:"Project 1", GroupTextTooltip:"Project 1" },
            { key: "a", group: "Project 1", row: 3, date: new Date(new Date(2020,04,08,17,40).valueOf()), length: 3, text: "1º Task", color: "lightgreen" },
            { key: "b", group: "Project 1", row: 5, date: new Date(new Date(2020,04,08,17,40).valueOf() + 3 * MillisPerHour), length: 1, text: "2º Task", color: "lightgreen" },
            { key: "c", group: "Project 1", row: 7, date: new Date(new Date(2020,04,08,17,40).valueOf() + 4 * MillisPerHour), length: 7.5, text: "3º Task", color: "yellow" },
            { key: "d", group: "Project 1", row: 9, date: new Date(new Date(2020,04,08,17,40).valueOf() + 16.5 * MillisPerHour), length: 10, text: "4º Task", color: "yellow" },
        ],
        [ // link data
          { from: "a", to: "b" },
          { from: "b", to: "c" },
          { from: "c", to: "d" },
        ]);
    }

    console.log(myDiagram.model);

    initColumnHeaders();
    initRows();
  }
</script>
</head>
<body onload="init()">
  <div id="myColumnHeadersDiv" style="flex-grow: 1; height: 40px; border: solid 1px black"></div>
  <div id="myDiagramDiv" style="flex-grow: 1; height: 400px; border: solid 1px black"></div>
  <textarea id="mySavedModel" style="width:100%;height:250px"></textarea>
</body>
</html>
Thank you in advance for your time, and for your attention.