@kumar1 wrote:
How to change panelExpanderButton color
$(“PanelExpanderButton”, “LIST”, // the name of the element whose visibility this button toggles
{ row: 0, alignment: go.Spot.TopRight}),
Posts: 1
Participants: 1
@kumar1 wrote:
How to change panelExpanderButton color
$(“PanelExpanderButton”, “LIST”, // the name of the element whose visibility this button toggles
{ row: 0, alignment: go.Spot.TopRight}),
Posts: 1
Participants: 1
@kumar1 wrote:
i have seen solution is to initialize toArrow default value, how can i do that in angular?
this.dia.linkTemplate =
        $(go.Link,  // the whole link panel
         { selectable: true, selectionAdornmentTemplate: linkSelectionAdornmentTemplate },
          { relinkableFrom: true, relinkableTo: true, reshapable: true },
          {
            routing: go.Link.AvoidsNodes,
            curve: go.Link.JumpOver,
            corner: 5,
            toShortLength: 4
          },
          new go.Binding("points").makeTwoWay(),
          $(go.Shape,  // the link path shape
            { isPanelMain: true, strokeWidth: 2 }),
          $(go.Shape, new go.Binding("toArrow", "toArrow")),
            $(go.Shape,  new go.Binding("fromArrow", "fromArrow")),// the arrowhead
          $(go.Panel, "Auto",
            new go.Binding("visible", "isSelected").ofObject(),
            $(go.Shape, "RoundedRectangle",  // the link shape
              { fill: "#F8F8F8", stroke: null }),
            $(go.TextBlock,
              {
                textAlign: "center",
                font: "10pt helvetica, arial, sans-serif",
                stroke: "#919191",
                margin: 2,
                minSize: new go.Size(10, NaN),
                editable: true
              },
              new go.Binding("text").makeTwoWay())
          )
        );
Posts: 1
Participants: 1
@kumar1 wrote:
class LinkComponent //angular component {
public editAttributeId = ‘’;public initDiagram(): go.Diagram {
let textblockClick = (e, obj) => {
let item1 = e.diagram.selection.first().data.items.find(i => i.name == obj.text);
this.editAttributeId = item1.id; this is always showing Diagramcomponent
how to access editAttributeId here from Linkcomponent
var node = obj.part;
}
//here initilze diagramnodetemplete
in nodetemplete -> panel -> textblock -> click event ->textblockClick
}
}if not possible please suggest me different scenarios
Posts: 1
Participants: 1
@walter wrote:
Changes for 2.1.17
- Added the Radial Adornment Buttons sample, showing a selection Adornment, only on one node, that is like a context menu with buttons arranged in a circle around the selected node.
- Added the Donut Charts sample, showing a simple circular bar chart in each node.
- Fixed exporting the Picture.reloadSource and Picture.redraw methods.
- Fixed the LinkingBaseTool.temporaryFromPort and LinkingBaseTool.temporaryToPort property setters to replace the port of the corresponding temporary node. This allows customization of a LinkingTool by setting either or both of those two properties.
- Fixed Diagram.makeImage with a Picture SVG data URI source, in the same manner as in 2.1.16.
- Fixed undo of a Shape.geometry setting, after its GraphObject.desiredSize had been set. This particular sequence of events was discovered in the use of the GeometryReshapingTool extension.
For previous releases, see: GoJS version 2.1.16
Posts: 1
Participants: 1
@CarbonCollins wrote:
Hi,
We are trying to change the colour of the grid lines/background dynamically to allow live theme switching in our app. We are able to do this to nodes quite easily through bindings. However, the bindings don’t seem to work on the grid properties (unassuming because the data to bind to is in the node model data and is not available to the grid template).
Is there a way to use bindings in the grid template or do I have to update it by recreating/redrawing the grid in the diagram?
Thanks in advance
Posts: 1
Participants: 1
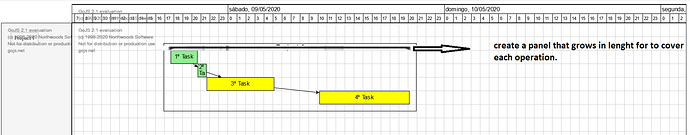
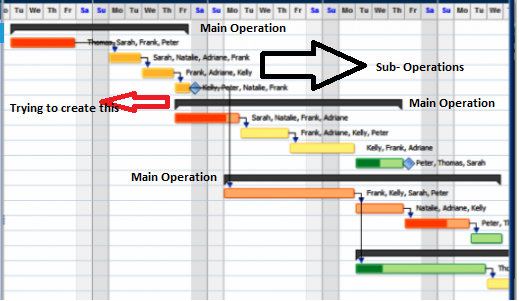
@RSilva wrote:
Good Morning,
I’m creating a Gantt Diagram, and my current objective is to create a panel that covers each sub-operation. In other words, my “Project” will consist in many Operations(each has it sub-operations).
Watching the imagem below my sub-operations is the “Task”, and the Main Operation is the panel that I’m trying to create.
Current code:
<!DOCTYPE html>
<html>
<head>
  <meta charset="UTF-8">
  <title>Gantt chart</title>
  <meta name="description" content="A Gantt chart that supports zooming into the timeline." />
  <meta name="viewport" content="width=device-width, initial-scale=1">
  <!-- Copyright 1998-2020 by Northwoods Software Corporation. -->

  <script src="go.js"></script>

 <script id="code">
  // Define Graduated Panels to show the days, to show the hours, and to separate the days and hours.

  // Assume x == 0 is OriginDate, local midnight of some date.
  var OriginDate = new Date(2020,4,8,0,0); // new Date Month starts at 0(January) and end in 11(December)

  // Assume 20 document units equals one hour.
  var HourLength = 20;
  var HoursPerDay = 24;
  var DayLength = HourLength * HoursPerDay;
  var MillisPerHour = 60 * 60 * 1000;
  var MillisPerPixel = MillisPerHour / HourLength;

  function init() {
var $ = go.GraphObject.make;

myDiagram =
  $(go.Diagram, "myDiagramDiv",  // create a Diagram for the DIV HTML element
    {
      isReadOnly: true,       // deny the user permission to alter the diagram or zoom in or out
      "animationManager.isEnabled": false,
      initialContentAlignment: go.Spot.TopLeft,
      grid:
        $(go.Panel, "Grid",
          { gridCellSize: new go.Size(HourLength, 30) },
          $(go.Shape, "LineH", { stroke: 'lightgray' }),
          $(go.Shape, "LineV", { stroke: 'lightgray' }),
        ),
      "draggingTool.isGridSnapEnabled": true,
      "resizingTool.isGridSnapEnabled": true,
      scrollMode: go.Diagram.InfiniteScroll,  // allow the diagram to be scrolled arbitrarily beyond content
      positionComputation: function(diag, pos) {  // but not too far vertically, or at all if fits in viewport
        var y = pos.y;
        if (diag.documentBounds.height < diag.viewportBounds.height) {
          y = 0;
        } else {
          y = Math.min(y, diag.documentBounds.bottom - diag.viewportBounds.height);
          if (y < 0) y = 0;  // don't show negative Y coordinates
        }
        return new go.Point(pos.x, y);
      },
      nodeTemplate:
        $(go.Node, "Auto",
          {
            height: 30,
            dragComputation: function(part, pt, gridpt) {
              return new go.Point(gridpt.x, Math.max(0, gridpt.y));
            },
            resizable: true,
            resizeAdornmentTemplate:
              $(go.Adornment, "Spot",
                $(go.Placeholder)//, //Comentado permite com que ele faça resize às "caixas"
                //$(go.Shape,  // only a right-side resize handle
                //  { alignment: go.Spot.Right, cursor: "col-resize", desiredSize: new go.Size(8, 8), fill: "dodgerblue" })
              ),
            toolTip:
              $("ToolTip",
                $(go.TextBlock,
                  new go.Binding("text", "", function(data) { return data.text + "\nstart: " + data.date + "\nhours: " + data.length; }))
              )
          },
          new go.Binding("position", "", function(data) { return new go.Point(convertDateToX(data.date), convertRowToY(data.row)); })
            .makeTwoWay(function(pos, data) { data.row = convertYToRow(pos.y); data.date = convertDateToX(pos.x); }),
          new go.Binding("width", "length", function(l) { return l * HourLength; })
            .makeTwoWay(function(w) { return w / HourLength; }),
          $(go.Shape, { fill: "white" },
            new go.Binding("fill", "color")),
          $(go.TextBlock, { editable: false }, //editable = true, permite com que ele alterar o texto
            new go.Binding("text").makeTwoWay())
        ),
      "ModelChanged": function(e) {  // just for debugging
        if (e.isTransactionFinished) {
          document.getElementById("mySavedModel").value = e.model.toJson();
        }
      },
      "undoManager.isEnabled": false // Se for igual a true, faz as funcionalidades do CTRL-Z
    });

myColumnHeaders =
  $(go.Diagram, "myColumnHeadersDiv",
    {
      isReadOnly: true,
      "animationManager.isEnabled": false,
      initialContentAlignment: go.Spot.TopLeft,
      allowHorizontalScroll: false,
      allowVerticalScroll: false,
      allowZoom: false,
      padding: 0
    });


// Basic coordinate conversions, between Dates and X values, and between rows and Y values:

function convertXToDate(x) { return new Date(OriginDate.valueOf() + x * MillisPerPixel); }

function convertDateToX(dt) { return (dt.valueOf() - OriginDate.valueOf()) / MillisPerPixel; }

function convertYToRow(y) { return Math.floor(y/30) + 1; }  // assume one-based row indexes

function convertRowToY(i) { i = Math.max(i, 1); return (i-1) * 30; }


function initColumnHeaders() {
  // Assume the Graduated Panels showing the days and hours are fixed in the document;
  // and by disallowing scrolling or zooming they will stay in the viewport.

  var gradScaleHoriz1 =
    $(go.Part, "Graduated",  // show days
      { layerName: "Grid", position: new go.Point(0, 0), graduatedTickUnit: HourLength },
      $(go.Shape, { geometryString: "M0 0 H3600" }),
      $(go.Shape, { geometryString: "M0 0 V20", interval: HoursPerDay }),  // once per day
      $(go.TextBlock,
        {
          font: "10pt sans-serif", interval: HoursPerDay,
          alignmentFocus: new go.Spot(0, 0, -2, -4),
          graduatedFunction: function(v) {
            var d = new Date(OriginDate);
            d.setDate(d.getDate() + v / DayLength);
            // format date output to string
            var options = { weekday: "short", month: "short", day: "2-digit", year: "numeric" };
            return d.toLocaleDateString("pt-PT", options);
          }
        })
    );

  var gradScaleHoriz2 =
    $(go.Part, "Graduated",  // show hour of day
      { layerName: "Grid", position: new go.Point(0, 20), graduatedTickUnit: HourLength },
      $(go.Shape, { geometryString: "M0 30 H3600" }),
      $(go.Shape, { geometryString: "M0 0 V20" }),  // every hour
      $(go.TextBlock,
        {
          font: "7pt sans-serif",
          segmentOffset: new go.Point(7, 7),
          graduatedFunction: function(v) {
            v = (v / HourLength) % HoursPerDay;  // convert document coordinates to hour of day
            if (v < 0) v += HoursPerDay;
            return Math.floor(v).toString();
          }
        }
      )
    );

  // Add each part to the diagram
  myColumnHeaders.add(gradScaleHoriz1);
  myColumnHeaders.add(gradScaleHoriz2);

  // Add listeners to keep the scales/indicators in sync with the viewport
  myDiagram.addDiagramListener("ViewportBoundsChanged", function(e) {
    var vb = myDiagram.viewportBounds;

    // Update properties of horizontal scale to reflect viewport
    gradScaleHoriz1.graduatedMin = vb.x;
    gradScaleHoriz1.graduatedMax = vb.x + vb.width;
    gradScaleHoriz1.elt(0).width = myColumnHeaders.viewportBounds.width;

    gradScaleHoriz2.graduatedMin = vb.x;
    gradScaleHoriz2.graduatedMax = vb.x + vb.width;
    gradScaleHoriz2.elt(0).width = myColumnHeaders.viewportBounds.width;
  });
}

function initRowHeaders() {
  myDiagram.addDiagramListener("ViewportBoundsChanged", function(e) {
    // Automatically synchronize this diagram's Y position with the Y position of the main diagram, and the scale too.
    myRowHeaders.scale = myDiagram.scale;
    myRowHeaders.position = new go.Point(0, myDiagram.position.y);
  });

  myDiagram.addDiagramListener("DocumentBoundsChanged", function(e) {
    // The row headers document bounds height needs to be the union of what's in this diagram itself and
    // the what's in the main diagram; but the width doesn't matter.
    myRowHeaders.fixedBounds = new go.Rect(0, myDiagram.documentBounds.y, 0, myDiagram.documentBounds.height)
      .unionRect(myRowHeaders.computePartsBounds(myRowHeaders.parts));
  });
}

function initRows() {
  myDiagram.groupTemplateMap.add("Project 1",
  $(go.Group, "Auto",
    $(go.Shape, { fill: "transparent", stroke: "black" }),
    $(go.Placeholder, { padding: 15 }),
    $(go.TextBlock,{
            alignment: go.Spot.Top,
            editable: false,
            margin: 1,
            font: "bold 15px sans-serif",
            opacity: 0.75,
          },
    new go.Binding("text", "GroupText")),
    {
      toolTip:
        $("ToolTip",
          $(go.TextBlock, { margin: 4 },
            new go.Binding("text", "GroupTextTooltip"))
        )
    }
  ));

  myDiagram.model = new go.GraphLinksModel(
    [
        { key: "Project 1",id:"asdadsasdasd", isGroup: true, category: "Project 1", GroupText:"Project 1", GroupTextTooltip:"Project 1" },
        { key: "a", group: "Project 1", row: 3, date: new Date(new Date(2020,04,08,17,40).valueOf()), length: 3, text: "1º Task", color: "lightgreen" },
        { key: "b", group: "Project 1", row: 4, date: new Date(new Date(2020,04,08,17,40).valueOf() + 3 * MillisPerHour), length: 1, text: "2º Task", color: "lightgreen" },
        { key: "c", group: "Project 1", row: 5, date: new Date(new Date(2020,04,08,17,40).valueOf() + 4 * MillisPerHour), length: 7.5, text: "3º Task", color: "yellow" },
        { key: "d", group: "Project 1", row: 6, date: new Date(new Date(2020,04,08,17,40).valueOf() + 16.5 * MillisPerHour), length: 10, text: "4º Task", color: "yellow" },

    ],
    [ // link data
      { from: "a", to: "b" },
      { from: "b", to: "c" },
      { from: "c", to: "d" },
    ]);
}

   function initOverview(){
 myDiagramOverview =
  $(go.Diagram, "myOverviewDiv",
    {
      isReadOnly: true,
      "animationManager.isEnabled": false,
      initialContentAlignment: go.Spot.TopLeft,
      allowHorizontalScroll: false,
      allowVerticalScroll: false,
      allowZoom: false,
      padding:10,
    });


  myDiagramOverview.nodeTemplate =
  $(go.Node, "Auto",
    { locationSpot: go.Spot.Center },
    $(go.Panel, "Vertical",
      { margin: 5 },
      $("Button",
        { margin: 5,
          click: function(e, obj){
            var nodeOverview = obj.part;
            var dataOverview = nodeOverview.data;
            myDiagram.nodes.each(function(node) {
            if (node instanceof go.Group){
                if(node.key == nodeOverview.key){
                   myDiagram.centerRect(node.actualBounds);
                }
              }
            });
          }
        },
        $(go.TextBlock, new go.Binding("text", "ProjectKey"),{
            editable: false,
            margin:5,
            font: "bold 10px sans-serif",
            opacity: 0.75,
        })),
    )
  );

  myDiagramOverview.layout = $(go.GridLayout, { wrappingColumn: 1 });


  var OverviewKeys = [];
  // Create buttons for each isGroup that exists, for better navegation for each Project
  myDiagram.nodes.each(function(node) {
    if (node instanceof go.Group){
      console.log(node.hb.GroupText)
      OverviewKeys.push({key:node.key,ProjectKey:node.hb.GroupText})
    }
  });
  myDiagramOverview.model = new go.GraphLinksModel(OverviewKeys);
  console.log(OverviewKeys)
}


initColumnHeaders();
initRows();
initOverview();
  }
</script>
</head>
<body onload="init()">
  <div style="width: 100%; display: flex; justify-content: space-between">
<div id="myEmptyCorner" style="width: 155px; border: solid 1px white"></div>
<div id="myColumnHeadersDiv" style="flex-grow: 1; height: 40px; border: solid 1px black"></div>
  </div>
  <div style="width: 100%; display: flex; justify-content: space-between">
<div id="myOverviewDiv" style="width: 155px; background-color: whitesmoke; border: solid 1px black"></div>
<div id="myDiagramDiv" style="flex-grow: 1; height: 400px; border: solid 1px black"></div>
  </div>
  <textarea id="mySavedModel" style="width:100%;height:250px"></textarea>
</body>
</html>
Thanks in advance for your time and attention
Posts: 1
Participants: 1
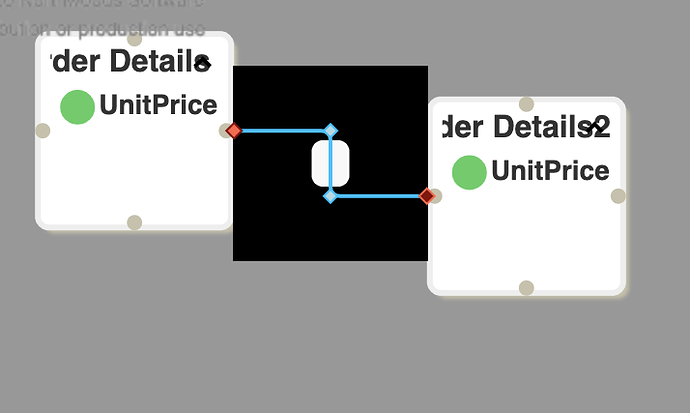
@sandeep0103 wrote:
thanks Walter for your reply. I tried following your suggestion but i am getting below compile time error(Cannot read property ‘findNodeForKey’ of undefined on line 170). here is my complete java script. I am calling this script from my Java selenium code the way it was mentioned in earlier in this forum. please help.
var js = document.createElement(“script”);
js.type = “text/javascript”;
js.src = “go.js”;var js1 = document.createElement(“script”);
js1.type = “text/javascript”;
js1.src = “robot.js”;var myDiagram;
var robot; // this global variable will hold an instance of the Robot class for myDiagramfunction init() { if (window.goSamples) goSamples(); // init for these samples -- you don't need to call this var $ = go.GraphObject.make; // for conciseness in defining templates function showProperties(e, obj) { // executed by ContextMenuButton var node = obj.part.adornedPart; var msg = "Context clicked: " + node.data.key + ". "; msg += "Selection includes:"; myDiagram.selection.each(function(part) { msg += " " + part.toString(); }); document.getElementById("myStatus").textContent = msg; } function nodeClicked(e, obj) { // executed by click and doubleclick handlers var evt = e.copy(); var node = obj.part; var type = evt.clickCount === 2 ? "Double-Clicked: " : "Clicked: "; var msg = type + node.data.key + ". "; document.getElementById("myStatus").textContent = msg; } myDiagram = $(go.Diagram, "myDiagramDiv", // must name or refer to the DIV HTML element { nodeTemplate: $(go.Node, "Auto", { click: nodeClicked, doubleClick: nodeClicked, contextMenu: $("ContextMenu", $("ContextMenuButton", $(go.TextBlock, "Properties"), { click: showProperties }) ) }, $(go.Shape, "Rectangle", { fill: "lightgray" }, { portId: "", fromLinkable: true, toLinkable: true, cursor: "pointer" }), $(go.TextBlock, { margin: 3 }, new go.Binding("text", "key"))), model: new go.GraphLinksModel([ { key: "Lambda" }, { key: "Mu" } ], [ { from: "Lambda", to: "Mu" } ]), "undoManager.isEnabled": true }); // a shared Robot that can be used by all commands for this one Diagram robot = new Robot(myDiagram); // defined in Robot.js // initialize the Palette that is on the left side of the page myPalette = $(go.Palette, "myPaletteDiv", // must name or refer to the DIV HTML element { nodeTemplate: myDiagram.nodeTemplate, model: new go.GraphLinksModel([ // specify the contents of the Palette { key: "Alpha" }, { key: "Beta" }, { key: "Gamma" }, { key: "Delta" } ]) }); } function dragFromPalette() { // simulate a drag-and-drop between Diagrams: var dragdrop = { sourceDiagram: myPalette, targetDiagram: myDiagram }; robot.mouseDown(5, 5, 0, dragdrop); // this should be where the Alpha node is in the source myPalette robot.mouseMove(60, 60, 100, dragdrop); robot.mouseUp(100, 100, 200, dragdrop); // this is where the node will be dropped in the target myDiagram // If successful in dragging a node from the Palette into the Diagram, // the DraggingTool will perform a transaction. } function copyNode() { var alpha = myDiagram.findNodeForKey("Alpha"); if (alpha === null) return; var loc = alpha.actualBounds.center; var options = { control: true, alt: true }; // Simulate a mouse drag to move the Alpha node: robot.mouseDown(loc.x, loc.y, 0, options); robot.mouseMove(loc.x + 80, loc.y + 50, 50, options); robot.mouseMove(loc.x + 20, loc.y + 100, 100, options); robot.mouseUp(loc.x + 20, loc.y + 100, 150, options); // If successful, will have made a copy of the "Alpha" node below it. // Alternatively you could copy the Node using commands: // myDiagram.commandHandler.copySelection(); // myDiagram.commandHandler.pasteSelection(new go.Point(loc.x+20, loc.y+100)); } function dragSelectNodes() { var alpha = myDiagram.findNodeForKey("Alpha"); if (alpha === null) return; var alpha2 = myDiagram.findNodeForKey("Alpha2"); if (alpha2 === null) return; var coll = new go.Set(); coll.add(alpha); coll.add(alpha2); var area = myDiagram.computePartsBounds(coll); area.inflate(30, 30); // Simulate dragging in the background around the two Alpha nodes. // This uses timestamps to pretend to wait a while to avoid activating the PanningTool. // Hopefully this mouse down does not hit any Part, but in the Diagram's background: robot.mouseDown(area.x, area.y, 0); // NOTE that this mouseMove timestamp needs to be > myDiagram.toolManager.dragSelectingTool.delay: robot.mouseMove(area.centerX, area.centerY, 200); robot.mouseUp(area.right, area.bottom, 250); // Now should have selected both "Alpha" and "Alpha2" using the DragSelectingTool. // Alternatively you could select the Nodes programmatically: // alpha.isSelected = true; // alpha2.isSelected = true; } function clickContextMenu() { var alpha = myDiagram.findNodeForKey("Alpha"); if (alpha === null) return; var loc = alpha.location; // right click on Alpha robot.mouseDown(loc.x + 10, loc.y + 10, 0, { right: true }); robot.mouseUp(loc.x + 10, loc.y + 10, 100, { right: true }); // Alternatively you could invoke the Show Context Menu command directly: // myDiagram.commandHandler.showContextMenu(alpha); // move mouse over first context menu button robot.mouseMove(loc.x + 20, loc.y + 20, 200); // and click that button robot.mouseDown(loc.x + 20, loc.y + 20, 300); robot.mouseUp(loc.x + 20, loc.y + 20, 350); // This should have invoked the ContextMenuButton's click function, showProperties, // which should have put a green message in the myStatus DIV. } function deleteSelection() { // Simulate clicking the "Del" key: robot.keyDown("Del"); robot.keyUp("Del"); // Now the selected Nodes are deleted. // Alternatively you could invoke the Delete command directly: // myDiagram.commandHandler.deleteSelection(); } function clickLambda() { var lambda = myDiagram.findNodeForKey("Lambda"); if (lambda === null) return; var loc = lambda.location; // click on Lambda robot.mouseDown(loc.x + 10, loc.y + 10, 0, {}); robot.mouseUp(loc.x + 10, loc.y + 10, 100, {}); // Clicking is just a sequence of input events. // There is no command in CommandHandler for such a basic gesture. } function doubleClickLambda() { var lambda = myDiagram.findNodeForKey("Lambda"); if (lambda === null) return; var loc = lambda.location; // double-click on Lambda robot.mouseDown(loc.x + 10, loc.y + 10, 0, {}); robot.mouseUp(loc.x + 10, loc.y + 10, 100, {}); robot.mouseDown(loc.x + 10, loc.y + 10, 200, { clickCount: 2 }); robot.mouseUp(loc.x + 10, loc.y + 10, 300, { clickCount: 2 }); }clickLambda();
Posts: 9
Participants: 2
@CarbonCollins wrote:
Hi,
We would like to see if there is a built in way of having the font size change depending on the length of the text (instead of wrapping or hiding with an ellipsis when its too long).
If there is no built in way then I assume I could make a basic binding that returns a font string based on the input value.
Thanks in advance!
Posts: 2
Participants: 2
@Xieguoiang wrote:
hello,
I have encountered the problem of node-side rendering order when using the newer version of gojs (version 2.1.11).
It will appear that the edge is rendered first, and then the page flashes to continue rendering. Of course, there will be slight changes in the edge (using the previous version, the same code does not happen), please show the following video or image:[视频]
Please point me out
thanks
Posts: 7
Participants: 2
@kumar1 wrote:
step 1:
once select the node and add two items to the array, second insertemitem overridding the first one also
step2:
select the node add the item in itemarray and unselect the node( click on background of diagram to unselect the node) and select it insert item into array working perfectly.this.selectedNode.diagram.model.commit((m) => { if(appComp.editAttributeId == '0' || appComp.editAttributeId != '' && appComp.editAttributeId != Preformatted text undefined) { let item = m.findNodeDataForKey(key).items.find(i => i.id == appComp.editAttributeId); m.set(item, 'name', newNodeData[0].name); m.set(item, 'type', newNodeData[0].type); m.set(item, 'primeryKey', newNodeData[0].primeryKey); } else { newNodeData[0].id = appComp.selectedNode.data.items.length; m.insertArrayItem(appComp.selectedNode.data.items, appComp.selectedNode.data.items.length,newNodeData[0]); } }, "clicked"); ``` i inserted 'hello2' it overrides Array[0] also0:
color: “#52ce60”
figure: “Circle”
id: 1
iskey: false
name: “hello2”
primeryKey: false
type: “string”
__gohashid: 1574
proto: Object
1: {iskey: false, color: “#52ce60”, figure: “Circle”, name: “hello2”, type: “string”, …} ```
Posts: 3
Participants: 2
@pawan wrote:
Hi Walter,
I am trying to remove node based on some condition and added diagram add listener for SelectionDeleting event. But it always delete whether I return true or false.
How I can I prevent node deletion based on some condition?Thanks .
Posts: 2
Participants: 2
@anvlkv wrote:
I’m using gojs to draw charts.
I need to put text labels along one of my graduated parts.
If I simply try to addnew go.Binding('text', '', (val, obj) => {return 'my text'})to theTextBlockon my part I still see numbers.How should I add this binding? Should I somehow provide items to graduated part?
Posts: 2
Participants: 2
@Charles wrote:
Basically I want to draw a link “on top” of the diagram, just to show an association, without it actually modifying the layout of the diagram. Is there a way to disable the layout modification caused by adding link (preferably without side effects like by disabling isOngoing on the layout or whatever, since I’d still like the layout to update independent of these links).
I had considered adding invisible placeholders for the links in a separate layer, and then binding them to the “source” part’s properties, but wanted to see if there was a more clever alternative before I went to all that trouble.
Posts: 2
Participants: 2
@Tulsani wrote:
Hey,
I am new to Gojs and was trying to create an application that allows the user to drag and drop images from a palette. I wishing that the images dropped on the diagram could be resizable and can be rotated. How could I implement it?Really thankful for the help.
code i was using for the same$(go.Diagram, "myDiagramDiv", { "undoManager.isEnabled": true }); myDiagram.nodeTemplate = $(go.Node, "Auto", { locationSpot: go.Spot.Center }, new go.Binding("location", "location", go.Point.parse).makeTwoWay(go.Point.stringify), $(go.Shape, "Circle", { fill: "white", stroke: "gray", strokeWidth: 2, portId: "", fromLinkable: true, toLinkable: true, fromLinkableDuplicates: true, toLinkableDuplicates: true, fromLinkableSelfNode: true, toLinkableSelfNode: true }, new go.Binding("stroke", "color"), new go.Binding("figure")), $(go.TextBlock, { margin: new go.Margin(5, 5, 3, 5), font: "10pt sans-serif", minSize: new go.Size(16, 16), maxSize: new go.Size(120, NaN), textAlign: "center", editable: true }, new go.Binding("text").makeTwoWay()), $(go.Picture, {width:50,height:50}, new go.Binding("source")) ); myPalette2 = $(go.Palette,"myPaletteDiv2", { nodeTemplate:myDiagram.nodeTemplate, contentAlignment:go.Spot.Center, layout: $(go.GridLayout,{ wrappingColumn:1,cellSize:new go.Size(2,2) }) }); myPalette2.model.nodeDataArray = [ {source:"1.png"}, {source:"2.png"}, {source:"3.png"}, ];
Posts: 1
Participants: 1
@Charles wrote:
As a follow up, is it possible to have a link/port ignore the locationObjectName property?
I need the behavior that has for the node itself (for linking, lining up layout, etc), but I still want links in the nondefault category to go directly to their ports, rather than being overridden.
Posts: 5
Participants: 2
@cacheq wrote:
My requirement is this: I need to run GoJS, using data stored in a local JSON file. However, when running the HTML file directly, data won’t load because of it violates the browser’s “CORS same-origin” security rule.
Because of security concerns when it comes to distribution, we do not want to have a web server provide the data file, nor do we want the end user to have to tweak the browser’s security setting.
Does anyone have experience getting around this issue? Perhaps using something like Electron to run a GoJS application?
Thanks in advance!
Posts: 2
Participants: 2
@ahmetgundogdu wrote:
I’m developing a History Manager. How do I get to the node data here? I will put the node key information in the name field but I couldn’t find the relevant node
let result = [];
this.diagram.undoManager.history.each((transaction) => {
                if (transaction.isComplete) {
                    result.push({
                        text: transaction.name,
                        name: *???* // *node key information*
                    });
                }
            });
Posts: 4
Participants: 2
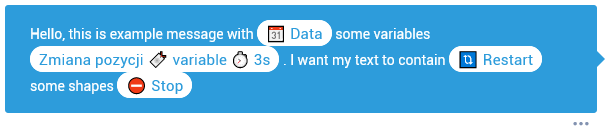
@Hazzed wrote:
Hello!
My node represents a message that contains variables represented by different shapes.
I want my node to look like this:
What is the easiest way to do this?
Posts: 2
Participants: 2
@Tulsani wrote:
Hey,
My diagram contains elements dropped from a palette containing Shapes and Pictures. I am trying to use the makeImageData function to get an image of the diagram. When download occurs I am able to see the shape nodes in the diagram but the images that were drag and dropped in the diagram were lostCode used identical to as shown in samples
  function myCallback(blob) {
      var url = window.URL.createObjectURL(blob);
      var filename = "myBlobFile.png";

      var a = document.createElement("a");
      a.style = "display: none";
      a.href = url;
      a.download = filename;

      // IE 11
      if (window.navigator.msSaveBlob !== undefined) {
        window.navigator.msSaveBlob(blob, filename);
        return;
      }

      document.body.appendChild(a);
      requestAnimationFrame(function() {
        a.click();
        window.URL.revokeObjectURL(url);
        document.body.removeChild(a);
      });
    }

    function makeBlob() {
      var blob = myDiagram.makeImageData({ background: "white", returnType: "blob", callback: myCallback });
    }
Output
Expected
![error]()
Thanks a lot in advance !
Posts: 4
Participants: 2
@sarvesh93 wrote:
I am using multiple node templates in my diagram. Is there a way to convert node templates and link template to JSON? The model to json function does not incluse these. Thanks
Posts: 3
Participants: 2